
62 GPU-Hours on One Box: How We Ran a Small-Model Evaluation on a DGX Spark
The other parts of this series ask what small models can do. This one is about how we found out: what it takes to run five open models through eight real tasks, two API references and a fine-tune, on one desk-side machine.
That machine is an NVIDIA DGX Spark: a GB10 Grace Blackwell chip with 121 GB of unified memory, meaning the CPU and GPU share one pool, on an aarch64 (ARM) system. Unified memory is the Spark’s appeal, since a 35B model fits easily. It also means every process on the box draws from the same pool: the model, the test containers, your other services, even the agent driving the study.
If you want to run a similar evaluation on a Spark or another unified-memory box, this is the post to read first. Most of what slowed us down had nothing to do with the models.
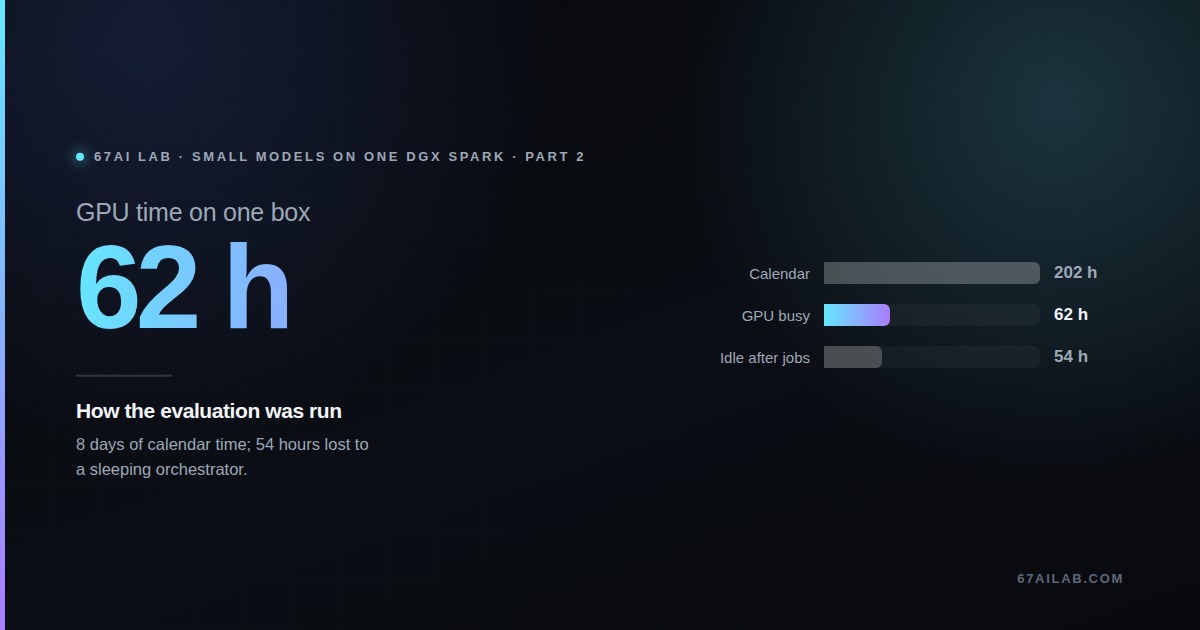
8 days 10 hours of calendar time (31 Oct 10:21 to 8 Nov 20:29), in 24 commits. About 62 hours of that was GPU work: roughly 38 h of single-call tasks, 11 h of coding agents, 9.5 h of tool-calling agents and 4 h of LoRA training.
API spend was about $60 on Claude Opus 5.5 before its credit ran out on day 1, and about $35 on DeepSeek-V4.1-Flash. The biggest single waste was about 54 hours of idle time after jobs had finished, because nothing told the orchestrating agent they were done.
The stack in one picture
Every task, from abstract screening to coding agents, talked to the same OpenAI-compatible endpoint. Only the harness in front of it changed.
A few choices in that stack matter more than they look:
| Layer | What we used | Why it matters |
|---|---|---|
| Serving | A separate study llama-server on :8090, --models-max 1 |
The production server on :8080 stayed untouched, and every model was measured with the box otherwise idle |
| Context | 262k total, 4 slots, kv-unified off |
Each slot gets its own 64k; a shared pool broke the agent tasks (see below) |
| Quantisation | ≈4-bit GGUF (UD-Q4_K_M, MXFP4_MOE, Q4_K_XL, Q4_K_M) | 28–56 GB per model |
| Coding agent | OpenCode in arm64 Docker images | SWE-bench only publishes x86 images; we built 19 env images locally |
| Tool-loop bench | tau2-bench text-v1 | Its default judge is an OpenAI model; we patched it to DeepSeek |
| Training | transformers 5.14, peft 0.19, torch 2.13 cu130, bf16 LoRA | A separate venv: the box’s production TTS venv pins transformers 4.57 |
“Router mode” means one llama-server process that loads whichever model a request names and unloads the previous one. “Slots” are parallel request lanes inside that server; four slots let four calls or four agents share one loaded model.
Eight days, start to finish
The first day did most of the setup. The harness, the serving smoke test (the subject of part 3) and the datasets for all eight tasks were committed by midday on 31 Oct. After that the shape is one task per commit, with two long gaps near the end.
| When | Milestone |
|---|---|
| 31 Oct 10:21 | Harness: study server, chat client, logging, results store |
| 31 Oct 10:56 | Serving smoke test: 4 of 5 models pass; Qwen3.8-27B conditional (too slow) |
| 31 Oct 11:29–12:11 | Datasets and harnesses for all 8 tasks; arm64 SWE-bench images built |
| 31 Oct 13:29 | First task finished (L2) |
| 31 Oct, by 19:33 | Anthropic API credit runs out; DeepSeek-V4.1-Flash takes over as reference and judge |
| 31 Oct 22:08 – 2 Nov 00:21 | E3, L1, L4, E2 and L3 results and audits |
| 2 Nov 00:21 | Fix: a dedicated 64k context per slot for the agent tasks |
| 2 Nov 09:15 | Production services stopped (2 GB free during E1) |
| 2 Nov 11:05 | E1 first pass at a 20-step cap done; rerun at 100 steps |
| 2 Nov – 4 Nov | E1 and E4 runs queued back to back (≈ 20 h); services restarted 3 Nov 04:47 |
| 4 Nov 14:06 | E4 results |
| 4 Nov – 6 Nov | E1 grading bug found, all 240 patches regraded; synthetic training data generated |
| 6 Nov 09:25 | E1 results committed |
| 6 Nov 09:30 – 14:07 | Services stopped again; LoRA smoke tests, then 3 h 53 min of training |
| 6 Nov 14:07 – 19:38 | Idle: training done, agent not woken (5.5 h) |
| 6 Nov 19:39 – 20:25 | L4 rerun with the tuned adapter (436 calls, 46 min) |
| 6 Nov 20:25 – 8 Nov 20:09 | Idle: rerun done, agent not woken (≈ 48 h, services still stopped) |
| 8 Nov 20:09 – 20:29 | Final check, services restarted, LoRA result and decision memo committed |
Where the GPU time went
We estimated GPU time from the logged latency of every call divided by the four parallel slots, and for the agent tasks from the summed per-task wall time divided by the four workers. API-only work, like generating synthetic training data, ran alongside GPU work and isn’t counted.
Estimated GPU hours per task on the Spark
Total ≈ 62 h. Bars start at zero; the axis runs to 15 h.
Two kinds of work dominate, for different reasons:
- Volume. L1 (3,603 abstracts × 5 models × 4 runs, 61k calls) and E3 (2,360 offers, 52k calls) are cheap per item but enormous in count.
- Agent loops. E1 ran only 200 agent runs per pass and E4 750 conversations, but each one is dozens of calls with a context that keeps growing. The E1 pass at a 20-step cap took about 3 h; the rerun at 100 steps took about 8 h, and Qwen3-Coder-Next alone took about 2.9 h of that.
Agents are also slower end to end than single-call speed suggests. The median E4 task took 130 s on Qwen3.6-35B-A3B against 38 s on the DeepSeek API, and the median E1 task 194 s against 56 s. At the serving level, the sparse mixture-of-experts (MoE) models with about 3B active parameters decoded 2.5–3x faster than the dense Qwen3.8-27B, at a third less memory. Qwen3.6 decoded 66.1 tokens/s in 27.6 GB, against 21.0 tokens/s in 42.4 GB for Qwen3.8.
Memory on a unified-memory box
On a discrete-GPU machine, the GPU’s memory is its own. On the Spark, everything shares 121 GB, and that shaped the whole schedule.
| What | Memory |
|---|---|
| Always-on production stack (llama-server 29 GB, plus TTS and ASR) | ≈ 44 GB |
| One 4-bit MoE study model | ≈ 28 GB |
| One SWE-bench test container | ≈ 1.5 GB, × 4 agents in parallel |
| Free memory during E1, with everything running | 2 GB |
| Loading a 35B bf16 model for training (65 GiB of weights) | 119 of 121 GB at peak |
| LoRA training itself, with gradient checkpointing | 81 GiB peak |
The lessons in plain terms:
- Production services and the study compete for one pool. At 2 GB free during E1 we stopped the production LLM, TTS and ASR services for the GPU-heavy phases. Over the study they were down for about 79 hours in two windows.
- A 4-bit MoE model plus four agents fits comfortably. 28 GB for the model and about 1.5 GB per container leaves plenty of room once the other services are off.
- Loading is the dangerous moment, not training. The stock loader briefly pushed used memory to 119 of 121 GB while loading 65 GiB of weights. Training then settled at 81 GiB.
- The orchestrating session is a memory consumer too. Under memory
pressure, the host running the agent that drove the study killed its own
background watcher shells. The jobs themselves survived, because we had
started them detached with
setsid/nohup. That turns out to matter in the next section.
What went wrong
Every problem below cost time or would have cost correctness. None of them was about how good the models were.
The ~54 hours nobody was watching
The study was driven by an agent session that launched jobs and watched for them to finish. Under memory pressure, the agent host killed the watcher shells. The jobs ran to completion, but nothing told the session they were done.
It happened twice in a row at the end. LoRA training finished at 14:07 on 6 Nov and sat unnoticed for 5.5 hours. The rerun of L4 with the tuned adapter then finished at 20:25 and sat for about 48 hours, until 20:09 on 8 Nov. Worse, the production services had been stopped to free memory for training, so they stayed down for those 48 hours too.
The contrast is instructive. Earlier, E1 and E4 ran as one detached queue script for about 20 hours back to back, and that script restarted the services itself at 04:47 on 3 Nov. Chain steps in a detached queue that also restores the box, and don’t rely on an interactive session to notice.
A grading cache that hid regressions
For E1 (part 8), a coding agent writes a patch and SWE-bench’s own grader runs the tests. Grading is slow, so we cached the reports, keyed by (model, task).
When we reran E1 at a 100-step cap, every task already had a cached grade from the 20-step pass, so the rerun silently reused the old grades. The first results showed no model losing any task, and counted one empty patch as solved. That looked wrong, and the audit found why. The cache is now keyed by the sha256 hash of the patch, and all 240 predictions were regraded. Key a cache by a hash of what is being graded, not by the name of the run.
Four agents, one shared context pool
The batch tasks ran with llama.cpp’s kv-unified setting on: one 64k
context pool shared by all four slots. That’s fine for short calls. The KV
cache (the model’s working memory for a conversation) of a coding agent grows
to about 30–60k tokens, so four agents at once overflowed the shared pool.
Agents got “Context size has been exceeded” errors and produced empty patches
after about 137 s.
The fix was a dedicated 64k per slot: ctx-size 262144 with kv-unified
off. All five models still fit beside the production stack. The first 8 E1
records made under the old setting were discarded and rerun.
A step cap that measured the budget, not the model
The plan gave each coding agent at most 20 steps (tool calls). On the first pass, 57–97% of local runs hit the cap, often in the middle of a fix. Qwen3-Coder-Next hit it in 97% of runs. At that point we were measuring the step budget, not the model.
We raised the cap to 100 and reported both passes. The decision for E1 didn’t change (it still needs a large model), but the numbers did: Qwen3-Coder-Next went from 7 to 24 resolved tasks, while Gemma 4 dropped from 15 to 10 because extra room let it fall into loops. A cap is part of the experiment, so pick it from a pilot run, not from a guess.
The rest of the list
- The frontier API ran out of credit on day 1. Opus has no E1 result and only a 29-task subset on E4. DeepSeek-V4.1-Flash took over as reference and judge, and we kept the partial Opus results, labelled. Make the reference model pluggable from the start.
- Benchmark containers were x86 only. The full SWE-bench Verified set wasn’t runnable on aarch64, so we built arm64 images and scoped E1 to 40 django and sympy tasks.
- The training loader picked the wrong class. Loading the model with
AutoModelForCausalLMgave a text-only class whose module names didn’t match the checkpoint. A 3-step smoke run caught it. The fix was to load the full multimodal class and feed it text only. - The serving runtime limits what a LoRA can target. llama.cpp reorders some attention heads and fuses experts when it converts a model, so we only targeted tensors that map one-to-one, and checked that the adapter applied (320 tensors).
- Synthetic training data was too easy. The LoRA learned the synthetic task, not the real one (part 12).
- The gold labels set the ceiling. On L4 even the API references stop at 76–78% (part 7). Audit where references disagree with the gold before tuning toward a bar.
The habits that paid off
- Fix the pass bars before any model runs, then audit every surprising score. The E4 audit showed Qwen3.6 beating DeepSeek was parity (12 vs 10 tasks where only one of them succeeded). The L3 audit showed local models lose on completeness, not correctness. The E1 audit found the cache bug.
- Read traces, not just scores. The most useful findings came from agent trajectories: Gemma’s 71-call loop, Nemotron’s invented ids, Coder-Next re-running tests after a correct fix.
- Have a second, large open-weight reference. DeepSeek-V4.1-Flash costs a fraction of Opus and scored within about 2 points of it on most tasks, which made it the realistic API alternative, and it rescued the study when Opus stopped.
- One commit per task, holding data, code, per-example scores and audit,
made the regrade and the final memo straightforward. Every number in the
reports traces to a committed
summary.json. The raw request logs (724 MB) stay out of git.
What this means if you run your own
A checklist for an evaluation on a DGX Spark or a similar unified-memory box:
- Budget memory before anything else. Production services, the study model and any agent containers must fit in 121 GB together. Plan the service downtime windows, and restart services from the job queue, not by hand.
- Use 4-bit MoE models for agent work. At 28 GB and 50–66 tokens/s they leave room for parallel agents. Dense 27B-class models are fine for batch jobs, not for interactive loops.
- Give each parallel slot its own context (
kv-unifiedoff) for agent workloads. - Run long jobs detached (
setsid/nohup) and chain them in one queue script that writes a completion marker. Don’t depend on an interactive session staying alive to start the next step. - Key every cache by a content hash of what it caches.
- Pilot the agent step cap and report results at more than one cap if runs are hitting it.
- For bf16 training of 30B+ models, re-shard the checkpoint or use a loader that writes straight to the GPU to avoid the load-time spike, stop other GPU users, and do a 3-step smoke run first.
- Check aarch64 support for benchmark containers on day 1, and budget time to build images.
- Make the API reference pluggable, and keep partial results with a label when a provider stops.
- Expect about 60 GPU-hours for 5 models × 8 tasks at this scale. Agent benchmarks dominate per item; screening and classification dominate by volume.
Limits. GPU hours are estimates from logged latency divided by the four slots or workers, not metered GPU utilisation. The Opus spend covers only the logged single-call tasks. Timings come from git history and the run logs; a commit time marks when results landed, not when the work began.