
When the Answer Key Is the Ceiling: Pulling Numbers out of Trial Papers
A meta-analysis pools the results of many randomised trials into one estimate. To do that it needs a few numbers from every paper: how many patients were in each arm, and either how many had the event (for a yes/no outcome) or the mean and standard deviation (for a measured one).
Pulling those numbers out by hand is slow, fiddly work. They hide in tables, footnotes and results text, and standard practice is to extract everything twice, by two people, and reconcile. A model that fills the extraction sheet for a person to check would save much of that time. Task L4 asks whether a model on a desk-side box can do it well enough.
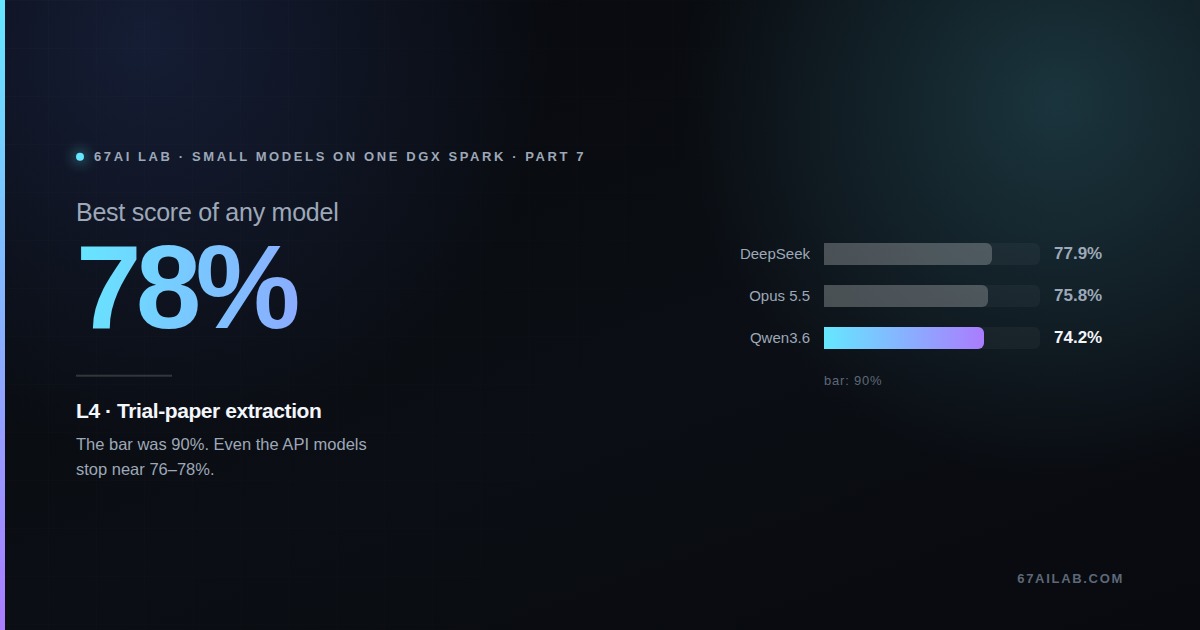
Close to the references, but nobody reaches the bar. The pass mark was 90% of cells exactly right. DeepSeek-V4.1-Flash scored 77.9% and Claude Opus 5.5 75.8%. The best local model, Qwen3.6-35B-A3B, scored 74.2%, 1.6 points behind Opus, and three more local models are within 5 points.
The ceiling is largely the answer key. On 16% of cells both large models give the same answer and the key disagrees. Without those cells the references score 90–93% and the good local models 83–84%. A follow-up LoRA fine-tune did not help (part 12).
The task in one picture
One call per paper. The model sees the paper’s text and a numbered list of the comparisons to fill, and returns one row of numbers per comparison.
A few terms. An arm is one group in a trial (the intervention or the comparator). The SD (standard deviation) is the spread of a measurement; papers often report an SE (standard error) or a 95% CI (confidence interval) instead, and the model has to convert those to an SD. A null means the paper doesn’t give the value, which is a correct answer when it is the right one.
The data
The test split of the llm-meta-analysis dataset (Yun et al. 2024, annotations under Apache-2.0), limited to papers whose full text we could retrieve from Europe PMC. Each row is an ICO triplet: one intervention, one comparator and one outcome.
| Item | Size |
|---|---|
| RCT papers | 109 |
| ICO triplets (rows to fill) | 648 |
| Scored cells per run | 3,550 |
| Cells the key leaves empty | 28% |
The paper texts are not republished, because per-article licences vary. Only the triplets and the answer key are committed. Figures and images are not given to the models, so a value shown only in a figure should come back null.
What a call looks like
The prompt asks for the number analysed for that outcome in each arm, and says to convert an SE or CI to an SD and to return null for anything the text does not report or let you compute. The paper below (PMC5122613) is paraphrased, not quoted.
1. [continuous] outcome: Left SCTT | intervention: Digestion-resistant
   maltodextrin | comparator: Placebo
2. [binary] outcome: Adverse events | ...
3. [continuous] outcome: Baseline characteristics and diet | ...
4. ... 5. ...
66 subjects analysed, 33 per group. The baseline section reports mean daily fibre intake of 10.0 ± 4.6 g (maltodextrin) and 11.5 ± 4.6 g (placebo); Table 1 also lists age, BMI and other characteristics.
{"row": 3, "intervention_group_size": 33, "comparator_group_size": 33,
 "intervention_events": null, "comparator_events": null,
 "intervention_mean": 10.0, "intervention_standard_deviation": 4.6,
 "comparator_mean": 11.5, "comparator_standard_deviation": 4.6}
Row 3 is a good picture of where the points go. Its outcome name is vague, and the annotators took the fibre-intake line:
| Field (row 3) | Key | Opus | DeepSeek | Qwen3.6 | Qwen3.8 | Gemma 4 | Nemotron |
|---|---|---|---|---|---|---|---|
| Group sizes (both arms) | 33 / 33 | 33 / 33 | 33 / 33 | 33 / 33 | 33 / 33 | 33 / 33 | 33 / 33 |
| Intervention mean, SD | 10.0, 4.6 | 10.0, 4.6 | null | 10.0, 4.6 | null | 21.1, 2.4 | null |
| Comparator mean, SD | 11.5, 4.6 | 11.5, 4.6 | null | 11.5, 4.6 | null | 21.5, 3.2 | null |
Every model gets the group sizes. Opus and Qwen3.6 then match the key. DeepSeek and Qwen3.8 decide the row isn’t extractable, Gemma 4 takes a different line from Table 1, and Nemotron 3.5 leaves the means empty. Reading a number off a table is easy. Choosing which number the annotator meant is where most of the score is lost.
Results
The pass rule was fixed before any model ran: at least 90% of cells exactly right, and within 5 points of Opus. A model that clears the gap but not the 90% lands on “needs tuning”, meaning a candidate for fine-tuning.
Cells exactly right, with and without the disputed cells
3,550 cells per run; local models are the median of 3 sampled runs. The second group drops the 563 cells where Opus and DeepSeek agree with each other and not with the key.
| Model | Exact (median) | Greedy | Cells the key fills | Whole row right | Δ Opus | Verdict |
|---|---|---|---|---|---|---|
| Opus 5.5 | 75.8% | – | 71.3% | 51.7% | – | baseline |
| DeepSeek-V4.1-Flash | 77.9% | – | 75.2% | 55.9% | +2.1 | reference |
| Qwen3.6-35B-A3B | 74.2% | 75.5% | 70.6% | 54.2% | −1.6 | needs tuning |
| Qwen3-Coder-Next | 73.3% | 74.7% | 71.9% | 48.9% | −2.5 | needs tuning |
| Gemma 4 26B-A4B | 72.9% | 73.8% | 70.3% | 49.1% | −2.9 | needs tuning |
| Qwen3.8-27B | 71.5% | 72.3% | 66.0% | 44.9% | −4.3 | needs tuning |
| Nemotron 3.5 30B-A3B | 59.6% | 62.7% | 64.5% | 32.4% | −16.3 | needs a large model |
“Greedy” is a single run at temperature 0, which always picks the most likely next token. It beat the sampled median for every local model, by 0.8–3.1 points. Qwen3.6’s three sampled runs spread from 70.3% to 75.4%, so its gap to Opus is inside its own run-to-run noise. Every call returned valid JSON.
The answer key is part of the problem
On 563 of 3,550 cells (16%), Opus and DeepSeek agree with each other and the key says something else. We read seven of those cells against the paper:
- References right, 3 cells. The key took a crossover-jump row for a triple-jump outcome; recorded a body weight (68.6 kg) for an outcome named “weight reduction” instead of the 0.37% reduction; and used the full arm size where a footnote gave the smaller number analysed, which is what the prompt asks for.
- Ambiguous, 3 cells. Randomised versus analysed group size, two plausible denominators, and a baseline versus an end-of-trial SD.
- Key right, 1 cell. The references counted 27 events where the table total is 21.
So the 90% bar can’t be reached against these labels by any model, and a model tuned hard towards 90% would mostly be learning the annotators’ habits. The gap between small and large models is still real, though. On the disputed cells the good local models give the references’ answer 64–74% of the time, and Nemotron 43%.
How the models go wrong
The models fail in different directions, which a single score hides. Here are the run-0 errors as a share of all cells:
| Model | Null where the key has a value | Value where the key is null | Wrong value |
|---|---|---|---|
| DeepSeek | 4.8% | 4.3% | 13.1% |
| Opus 5.5 | 7.3% | 3.5% | 13.4% |
| Qwen3.6 | 10.8% | 4.6% | 10.4% |
| Gemma 4 | 9.3% | 5.3% | 12.8% |
| Qwen3-Coder-Next | 5.9% | 5.6% | 14.8% |
| Qwen3.8 | 16.1% | 3.9% | 8.4% |
| Nemotron 3.5 | 7.7% | 14.0% | 21.7% |
- Qwen3.8-27B is the cautious one. It leaves 16% of known cells empty, often SDs that need an SE or CI conversion. It has the fewest wrong values but a lower score.
- Nemotron fills in cells the key leaves empty (14%) and has the most wrong values. It mostly fails on “not reported” cells.
- Invented numbers are rare. A wrong value that appears nowhere in the paper happens on 2.4–4.2% of cells, slightly more often for the references than for the local models.
The fine-tuning follow-up
L4 was the only task in the study where models landed on “needs tuning”, so it was the one we tried to fix with a LoRA: a small set of extra weights trained on top of a frozen model. We tuned Qwen3.6 on 1,232 synthetic trial papers. It got better at the synthetic papers (90.0% → 94.6%) but not at the real ones (74.2% → 73.8%). It got more reported values right and filled in more cells the key leaves empty, and the two cancelled out. Part 12 has the full story.
What this means if you extract data for meta-analyses
Extraction for a meta-analysis always needs a human check, and in that workflow a local model already does the first pass about as well as Opus:
- Use Qwen3.6-35B-A3B with greedy decoding. It is level with Opus within run-to-run noise, at a fraction of a cent per paper. Qwen3-Coder-Next and Gemma 4 are close behind.
- Ask for the SE/CI → SD conversion explicitly, and say which group size you want (randomised or analysed). Those two choices cause many misses.
- Keep the second reviewer. No model, small or large, is good enough to extract alone: even the best local model gets every cell of a row right only 54.2% of the time.
- Fix the labels before you tune. If you are building your own answer key, re-adjudicate the cells where two strong models agree against it.
Limits. The answer key has a substantial error and ambiguity rate, so absolute scores understate every model. Figures are not given to the models. The references got one run each and the local models three sampled runs plus a greedy run. We read only seven of the 563 disputed cells, so the split between key errors and genuine ambiguity is a sample, not a count.